(Lecture 6.) Last week measured elements. This week measures molecules two ways: first by how much light they absorb (UV-Vis, the oldest quantitative method in the toolkit), then by how their bonds vibrate (IR and Raman), which also tells crystal form apart from crystal form. Both matter for the same reason as everything else this term — the number only means something if you know which of its failure modes you’re looking at.
The one idea
A = εbc looks like a law of physics; treat it like one and you’ll misread every deviation as a sample problem when half are the instrument and half are chemistry the equation never promised to cover. Move to vibrations and the rule flips: IR and Raman see the same molecular vibrations through opposite selection rules — a vibration shows in IR if it changes the dipole moment, in Raman if it changes the polarisability — two halves of one picture, plus a second axis entirely in the solid-state techniques: how the identical molecules are packed, which changes dissolution and bioavailability without changing a single bond.
Near-IR is the outlier of the vibrational set: it sees only faint overtones and combination bands, broad and overlapping, carrying real information that no human can read off the plot — which is why NIR and chemometrics grew up together.
UV-Vis and Beer’s law
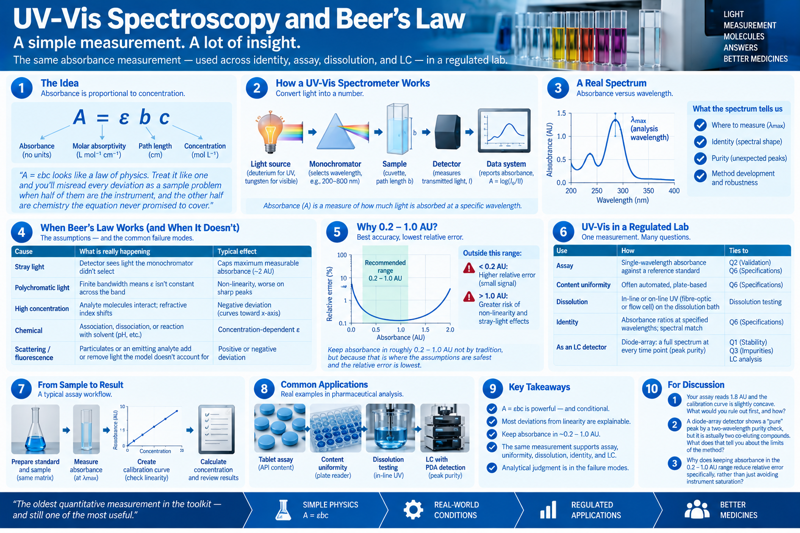
A = ε b c — absorbance equals molar absorptivity times path length times concentration. It holds when the light is monochromatic, the analyte is dilute and non-interacting, and nothing in the sample scatters or fluoresces. It fails — usually curving toward the concentration axis — for identifiable reasons:
| Cause | What is really happening |
|---|---|
| Stray light | The detector sees light the monochromator didn’t select; caps the maximum measurable absorbance (often ~2 AU) |
| Polychromatic light | Finite bandwidth means ε isn’t constant across the band; worse on sharp peaks |
| High concentration | Analyte molecules interact; refractive index shifts; the “dilute” assumption breaks down (roughly above 0.01 M) |
| Chemical | Association, dissociation, or a reaction with solvent changes the absorbing species as concentration or pH changes |
| Scattering / fluorescence | Particulates or an emitting analyte add or remove light the model doesn’t account for |
Absorbance is kept in roughly 0.2–1.0 AU not by tradition but because that is where the assumptions above are safest and the relative error is lowest.
| Use | How | Ties to |
|---|---|---|
| Assay | Single-wavelength absorbance against a reference standard | Q2 Validation, Q6 Specifications |
| Content / dosage-unit uniformity | Often automated, plate-based | Compression raised the same question in-process; this answers it with a number |
| Dissolution | In-line or on-line UV (fibre-optic or flow cell) on the dissolution bath — the highest-volume UV measurement in pharma | Dissolution |
| Identity | Absorbance ratios at specified wavelengths; spectral match | Q6 |
| As an LC detector | Diode-array: a full spectrum at every time point, used for peak purity | Q1 Stability, Q3 Impurities, and separations two weeks from now |
The common thread across all five uses: it’s the same absorbance measurement, pointed at a different question. What changes is not the physics, it’s which deviation from Beer’s law you have to worry about for that particular use — stray light matters enormously for a high-absorbance assay and barely at all for an identity check.
The vibrational and fluorescence techniques
| Technique | Probes | Strengths | Watch out for |
|---|---|---|---|
| Mid-IR (FTIR, usually ATR) | Fundamental vibrations, 4000–400 cm⁻¹; the fingerprint region | Definitive identity; minimal sample prep with ATR; solid-form sensitive | Water absorbs strongly; ATR samples only a few µm of surface |
| Raman | Same vibrations, via inelastic scattering | Water-compatible; through glass and plastic; non-destructive; point or image | Fluorescence can swamp the signal; laser can heat or photodegrade; weak effect |
| Near-IR (NIR) | Overtones and combinations of C–H, O–H, N–H | Fast, no prep, penetrates bulk; ideal for moisture, blend, coating | Uninterpretable without a calibration model; needs a reference method |
| Fluorescence | Electronic transitions of the few analytes that emit | Very high sensitivity and selectivity when it applies | Few analytes; quenching; inner-filter effects; photobleaching |
Adjacent techniques — the solid-state toolbox
Not this week’s core content, but worth knowing exists: the API is the same molecule in every crystal form, and a separate family of techniques reads how it’s packed rather than what bonds it has — X-ray powder diffraction (the polymorph/hydrate/salt identity method), differential scanning calorimetry and thermogravimetric analysis (melting, transitions, Tg; water/solvent content), dynamic vapour sorption (hygroscopicity, amorphous content), polarised light microscopy (a fast first look), and solid-state NMR (polymorph ID and quantitation — the same nucleus-in-a-field physics as the NMR sessions earlier in the term, applied to a solid rather than a solution). Week 9 covers the first two in full. The recurring teaching point, if you go looking: amorphous content — a small amorphous fraction is more soluble, less stable, and often invisible to XRPD below ~5%, and it’s the classic hidden variable behind a batch that suddenly fails dissolution.
What all of this is used for
| Use | Technique | Ties to |
|---|---|---|
| Identity of drug substance and excipients | Mid-IR fingerprint; Raman | Q6 |
| Water / residual solvent | NIR, Karl Fischer (Week 8) | Q6, Q3C |
| Blend uniformity, content, coating thickness | NIR, Raman — often in- or on-line | A teaser for Week 11’s PAT and automation |
| Incoming-material verification (100%, through the container) | Handheld / transmission / spatially-offset Raman | Q7 GMP |
| Photostability light dose | Quinine actinometry | Q1B |
| Counterfeit / falsified-medicine screening | Handheld Raman and NIR in the field | Supply-chain security |
Making the result trustworthy
For an identity test: the reference spectrum, matched sampling, a documented acceptance criterion (a correlation threshold or specified band/peak positions, not “looks the same”), and awareness that a polymorph difference can fail an over-tight identity test for the right reason. For a quantitative NIR or Raman method you are validating a model, not just an instrument: the calibration set must span every source of variation the method will meet, a reference method supplies the truth values, and preprocessing is locked with the model.
Compendial basis: USP ⟨857⟩ (UV-Vis), ⟨854⟩ (MIR), ⟨858⟩ (Raman), ⟨1119⟩ (NIR), ⟨941⟩ (XRPD), ⟨891⟩ (thermal analysis); Ph. Eur. 2.2.25 / 2.2.24 / 2.2.48 / 2.2.40 / 2.9.33 / 2.2.34.
Risk-assessment assignment (Risk Homework, checkpoint 2 of 3)
Take an in-line NIR blend-uniformity method and build the method FMEA against its analytical target profile (Week 2 approach). Weight the failure modes a spectroscopic model adds over a wet method: an out-of-calibration-range sample, probe-window fouling, feed-material drift, a stale model. Score their detectability — which would the running system actually catch? The third checkpoint is mass spectrometry.
Reading a Certificate of Analysis
A CoA is one page listing every routine test on a batch, the result, the specification, and pass/fail. Reading one competently, on day one, means recognising where every line came from — pulling together everything the course has taught so far, and everything still to come:
| CoA line | Specification example | Method | Where it’s taught |
|---|---|---|---|
| Appearance | White to off-white tablet | Visual | — |
| Identification | Conforms to reference spectrum | IR or Raman | This week |
| Assay | 95.0–105.0% label claim | HPLC (UV) | Week 8 |
| Related substances | Any individual impurity ≤ 0.15% | HPLC (UV/DAD) | Week 8 |
| Dissolution | Q ≥ 80% in 30 min | UV or HPLC on dissolution apparatus | Week 9 |
| Water content | ≤ 3.0% w/w | Karl Fischer | Week 8 |
| Elemental impurities | Each ≤ Q3D PDE-derived limit | ICP-MS | Week 5 |
| Polymorphic form | Form II by XRPD | XRPD | Week 9 |
| Uniformity of dosage units | AV ≤ 15 | Weight + HPLC assay | Week 2 + Week 8 |
A CoA is only as good as the specification behind it: every line is a risk decision in numeric form (Week 2), and a competent reviewer can trace any single number back to the manufacturing step it’s protecting (Week 2’s unit-operations tables) and the method that produced it.
Where the analyst sits
A spectrum takes seconds to acquire and can take a career to interpret responsibly. The instrument always returns a number or a “match”; the judgment is whether the match means what it appears to. That is the STEAM “A”. The refrain: science → evidence → reduced uncertainty → control → regulatory confidence → patient trust.
On the job
- Your first instrument qualification is likely to be a UV-Vis — you’ll run a calibration check, log it, and know what to do when it fails, before you ever run a real sample.
- Reading a CoA and being able to say, for every line, “here’s the method, here’s roughly why the limit is what it is” is one of the fastest ways to look competent in your first week.
- A drug substance passing HPLC assay but failing an IR identity test is a stop-the-batch event, not a retest-and-move-on event — know the difference before it happens to you.
- Polymorph identity tests are one of the more common places a new hire’s “it looks the same to me” gets corrected by an experienced reviewer — XRPD pattern comparison is a documented-criterion exercise, not a visual one.
For discussion
- Your assay reads 1.8 AU and the calibration curve is slightly concave. List the causes in the order you would rule them out, and how.
- A diode-array UV detector on an LC shows a “pure” peak by absorbance ratio at two wavelengths, but the peak is later shown to co-elute two compounds. What does that tell you about the limits of a two-wavelength purity check?
- A drug substance passes HPLC assay and impurities but fails its IR identity test. Give two innocent explanations and two that would stop the batch.
- Pick any line on the CoA table and trace it back to the manufacturing or testing step it’s protecting against. What would show up on that line if that step went wrong?
Source note. Beer–Lambert deviations follow standard instrumental-analysis texts (Skoog; Harris). Vibrational spectroscopy follows standard texts (Skoog; Smith, Modern Raman Spectroscopy); solid-state characterisation follows Brittain, Polymorphism in Pharmaceutical Solids. Compendial: USP ⟨857⟩/⟨854⟩/⟨858⟩/⟨1119⟩/⟨941⟩/⟨891⟩, Ph. Eur. equivalents. CoA structure follows USP ⟨1080⟩ and general GMP batch-release practice. (Instructor: source a real, de-identified small-molecule CoA to project during the closing section — it lands far better than the table alone.)